An Overview of the Dashboard Module
The dashboard allows admin to quickly see the health of their whole system. The server dashboard encapsulates information across the entire private cloud while each client has a dashboard unique to its own data.The Server Dashboard
The server dashboard include summary statistics of the number of unresolved errors, device’s online and offline status, disk usage on the server machine, a comprehensive rule overview, and general usage information for all clients, such as free disk space, CPU usage, and RAM usage. The dashboard also has quick links to navigate to rules, jump to the device summary table, or jump to the errors tab when an error arises.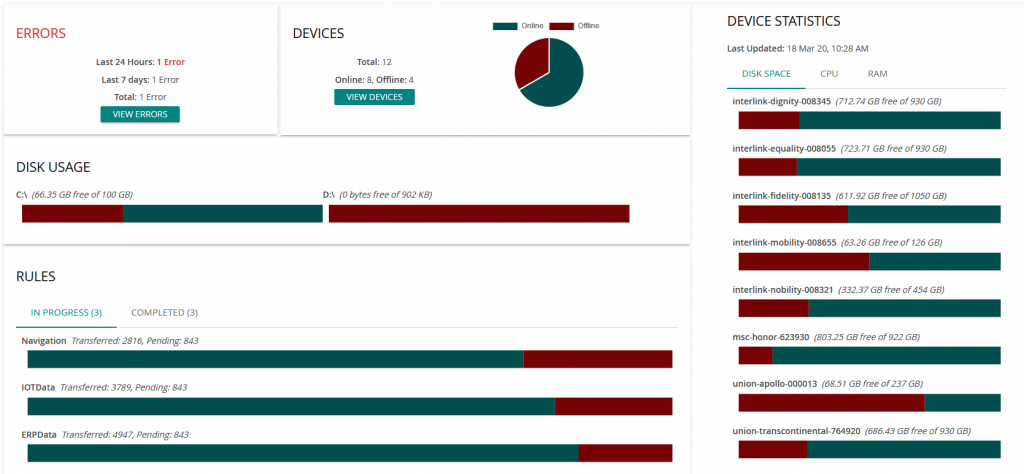
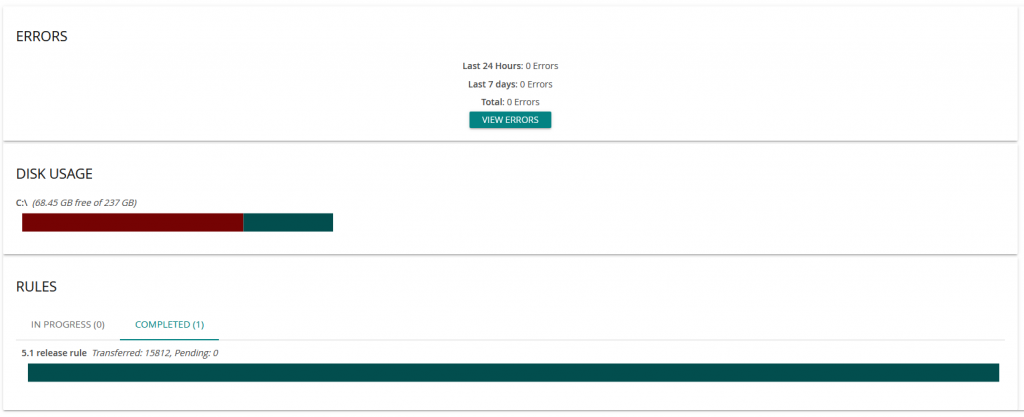
The Client Dashboard
Client dashboards include summary statistics on the errors specific to that client, disk usage stats for the client, and a comprehensive rule overview specific to the client. All quick links mentioned in the server dashboard are present on the client dashboard. Client dashboards can also be seen by the server via the remote management option.